
How to Debug a webpage in Chrome
In this post, I'm going to show you several ways to debug javascript in Google Chrome.
TLDR: Shift + ctrl + c
Open the javascript console using the shortcut shift + ctrl + c. That means, press all three at the same time. If you're on a Mac, use cmd rather than ctrl.
Inspecting an element to add new styles
Open the dom example that we wrote in What is the DOM?. In this post, we'll use that page to explore three ways to find out what's going on in a webpage. The code should look something like this.
<!DOCTYPE html>
<html>
  <head>
    <title>How to modify the DOM using JavaScript</title>
  </head>
  <body>
    <div id="post">
      Lorem ipsum dolor sit amet, consectetur adipiscing elit, sed do eiusmod tempor incididunt ut labore et dolore magna aliqua. Ut enim ad minim veniam, quis nostrud exercitation ullamco laboris nisi ut aliquip ex ea commodo consequat. Duis aute irure dolor in reprehenderit in voluptate velit esse cillum dolore eu fugiat nulla pariatur. Excepteur sint occaecat cupidatat non proident, sunt in culpa qui officia deserunt mollit anim id est laborum.
    </div>
    <script>
      let blogPost = document.getElementById("post");
      let copyrightNotice = document.createElement("p")
      copyrightNotice.innerHTML = "Copyright " + new Date().getFullYear() + " by the author";
      blogPost.append(copyrightNotice);
    </script>
  </body>
</html>
After opening it in Chrome, right click on the copyright notice, then click "Inspect" in the popup menu. The html for the element you clicked should appear in the "Elements" tab of the browser console. It should look something like this but there are several places where the console can appear.
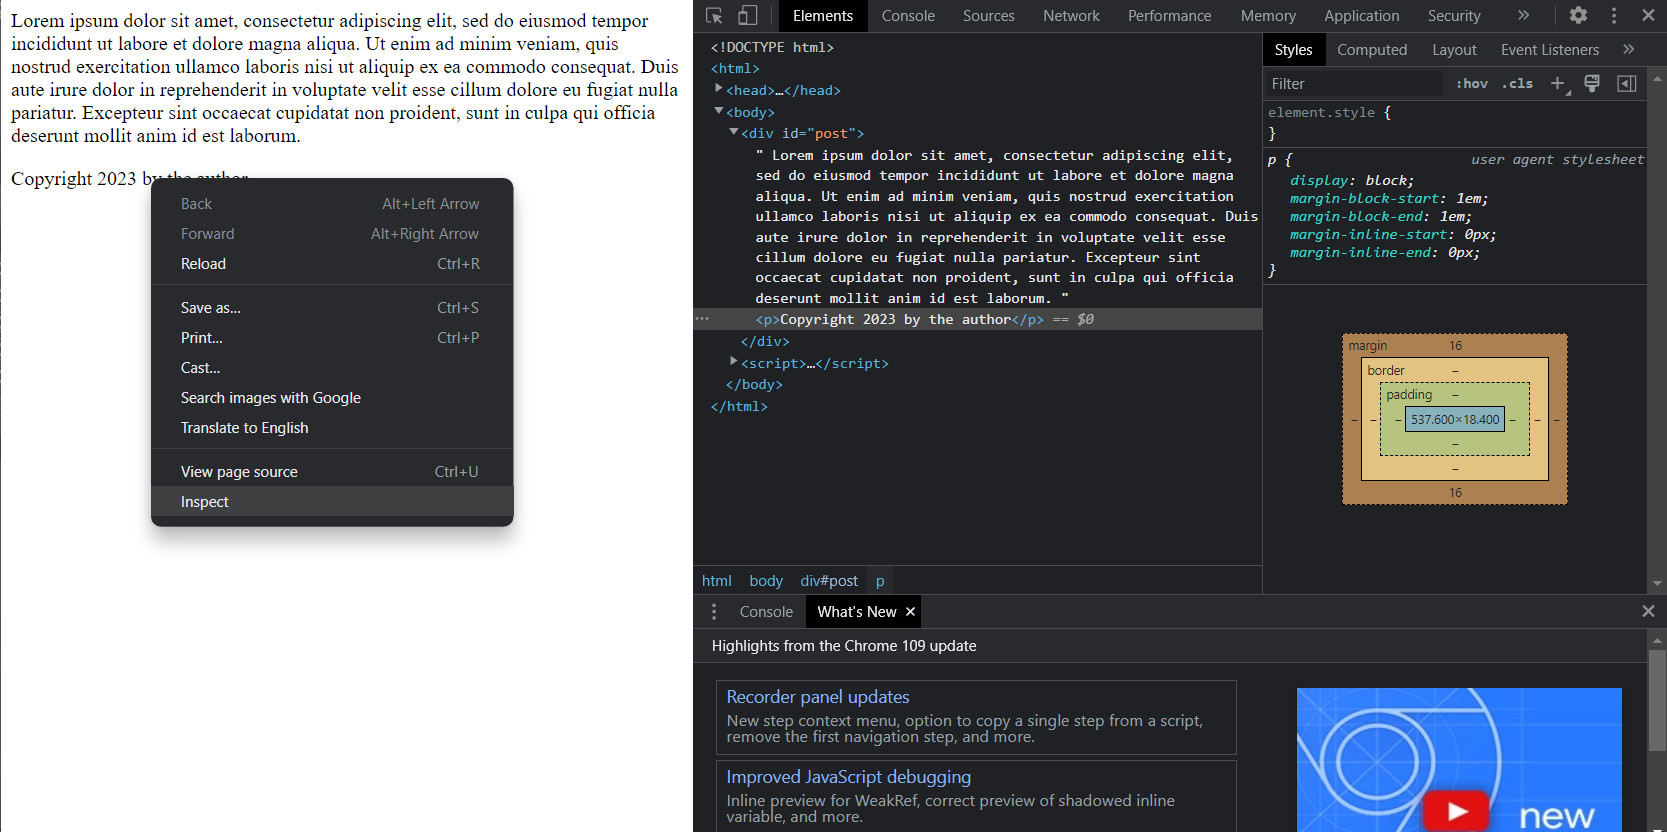
Any time you are confused about an element, inspecting it is a good place to start. In the browser console, you should be able to see the html for the element, as well as any attached css. In fact, you can actually add new styles using the browser console. Notice in the "Styles" tab where it says "element.style" and there are empty braces. Any CSS you type in there will be applied to the selected element. Styles can also be toggled on and off. This can be exceptionally handy when trying to figure out why your page doesn't look quite right.
Go ahead and try it. Enter "font-weight: 800" into element.style. What happens?
Debugging using console.log
The most basic way to debug JavaScript is to put some console.log statements into your code, then open the console and see what they print. Calling console.log tells the browser to print whatever you pass in in the JavaScript console. You can console.log just about anything, but the web browser will format variables automatically if you put them in an object using curly braces.
So the following console.log call isn't very useful.
console.log('HERE!');
Whereas the following console.log call will allow you to examine the object passed int.
console.log({ confusingVariable });
Add the following line of code to the dom example after it sets the copyrightNotice variable.
console.log({ copyrightNotice });
Then reload the page and use shift + ctrl + c to open the browser console, or shift + cmd + c on a Mac. You may have to expand the window and click over to the tab that says "Console".
You should see something that says "{ copyrightNotice: p }", and if you expand it, then you should be able to see all the properties associated with that variable. It's not particularly useful in this simple example, but I use this technique virtually every day as a web programmer.
Debugging using the Chrome debugger
Keep the dom example open in Chrome. Then press shift + ctrl + c to open the browser console. Navigate over to the "Sources" tab. This tab is the built in debugger provided by Google Chrome. In this debugger, you can add breakpoints to your code, and the browser will stop at the breakpoints and allow you to examine the state of your code. It's okay if this looks very confusing. We don't need to do much with it.
There are three things you need to be able to do. First, you need to be able to navigate to the sources tab. Then you need to find the line numbers, because you need to click them. This is much more difficult in a typical web page that has many files. Finally, you need to know how to continue running the page after it stops at your breakpoints.
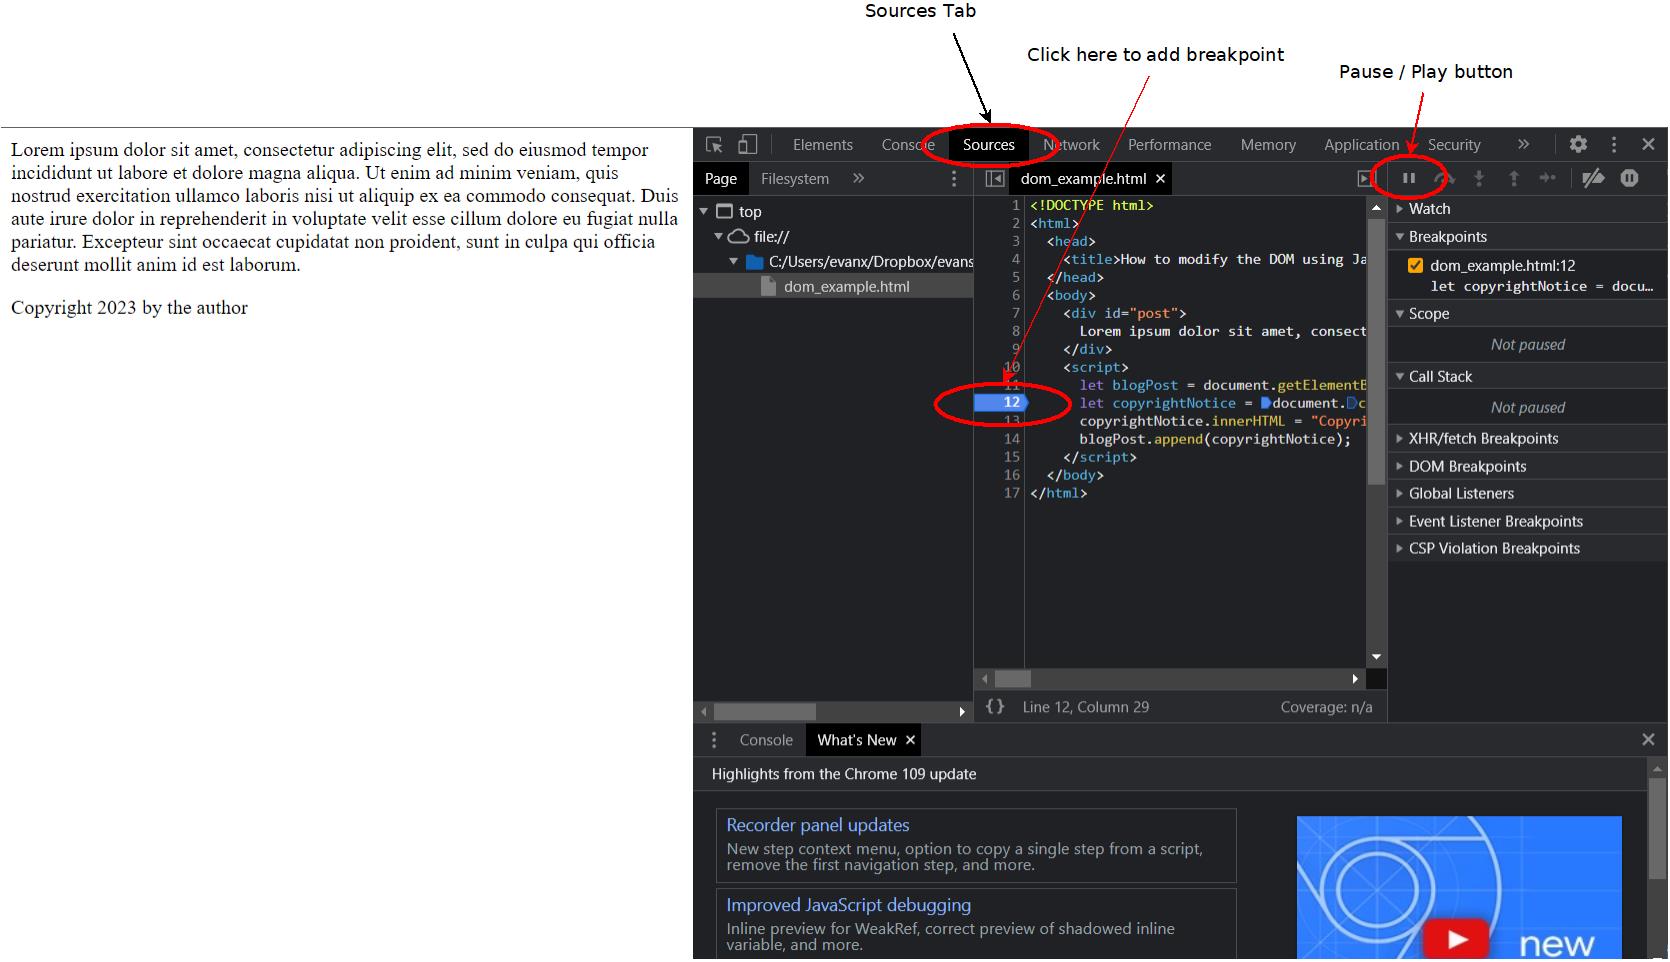
After you've opened up the page, click line 12 to set a breakpoint there. In this case, that code has already been run, so reload the page to make it run again. When you do so, you should see something like the following.
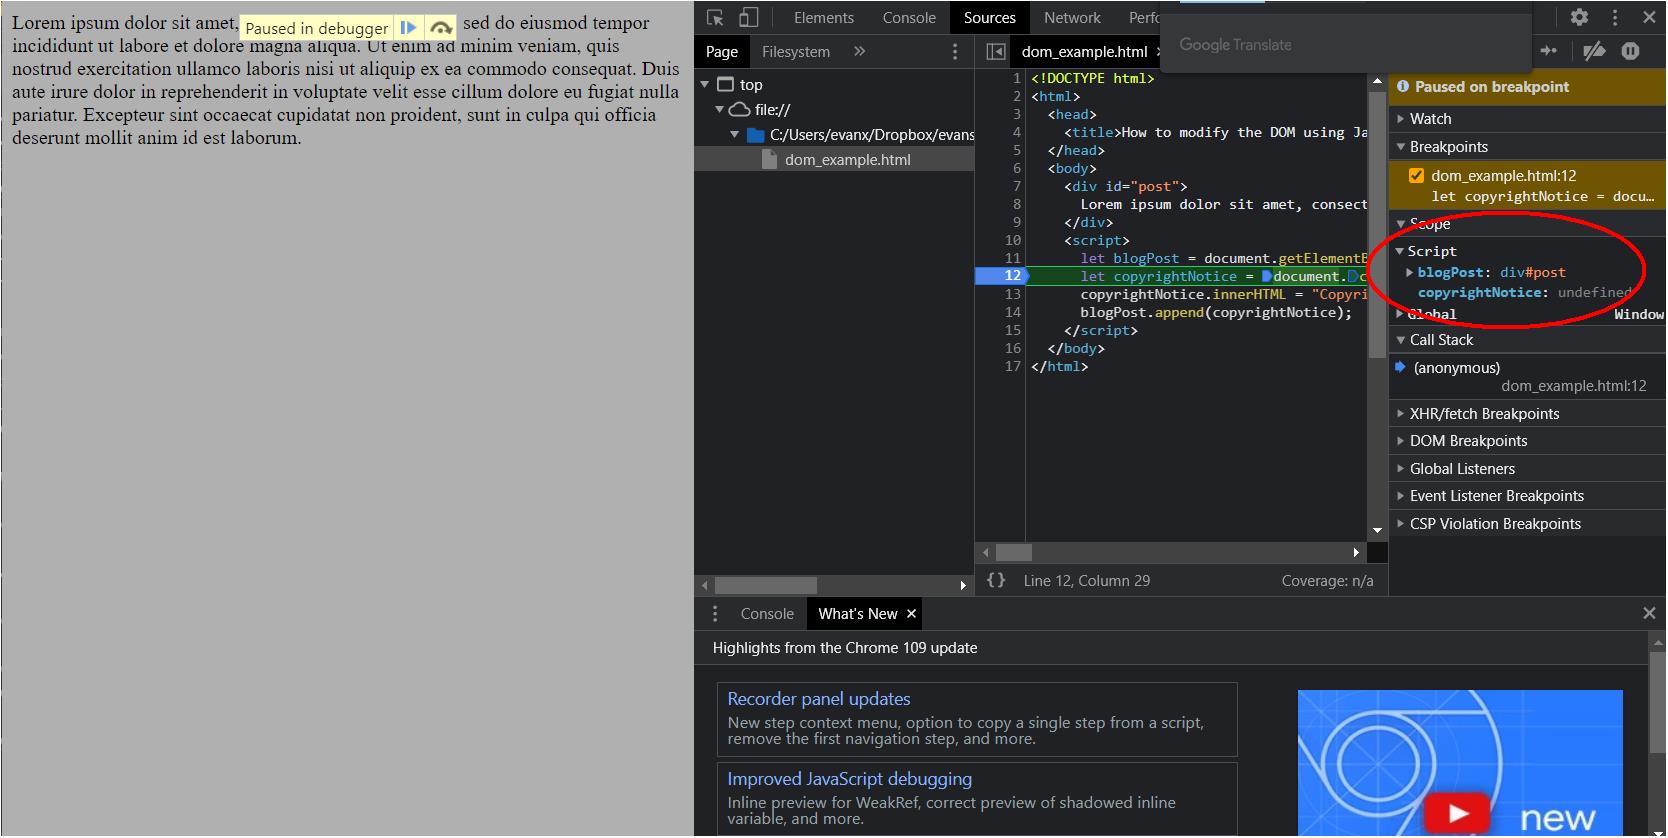
Notice the area that I've circled in that screenshot. It's where you can see the state of your code. All of your variables should appear there and you should also see their values. Notice that copyrightNotice is undefined in this case. That's because Chrome pauses before running the code at the line where you placed your breakpoint. If you place a breakpoint on the next line, then press the play/pause button to resume execution, the value for copyrightNotice should be filled in.
The Chrome debugger is a great way to examine the state of your code.